
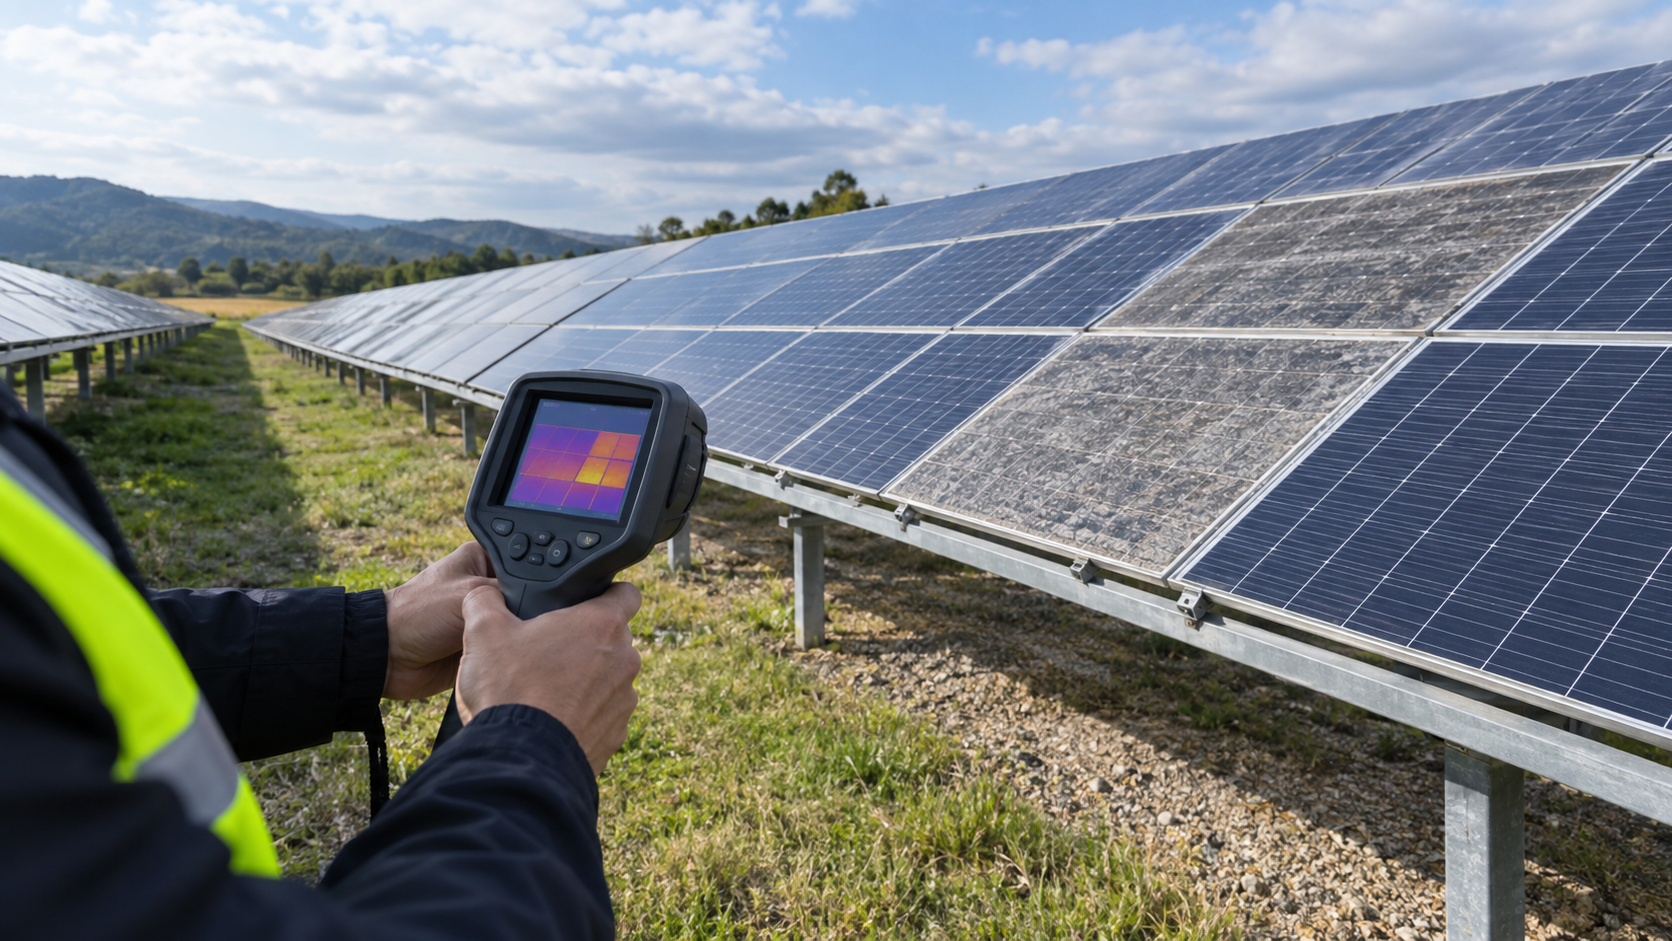
What degradation rate means
Degradation rate is the percentage of rated power a module loses each year under normal operation. It is quoted as an annual figure, applied on a compounding basis, and it is separate from the larger first-year drop that most technologies exhibit. A module rated at 0.45 percent per year does not lose 0.45 percent of the original nameplate each year in a straight line; it loses 0.45 percent of its current output, which produces a curve that flattens slightly over time.
Degradation is caused by several physical mechanisms working together: gradual encapsulant discoloration reducing light transmission, thermal cycling fatiguing cell interconnections, moisture ingress at the module edges, potential-induced degradation under system voltage stress, and light-induced effects in the first hours and weeks of exposure. It is a normal ageing process, distinct from outright failure such as a cracked cell, a delaminated backsheet or a failed junction box.
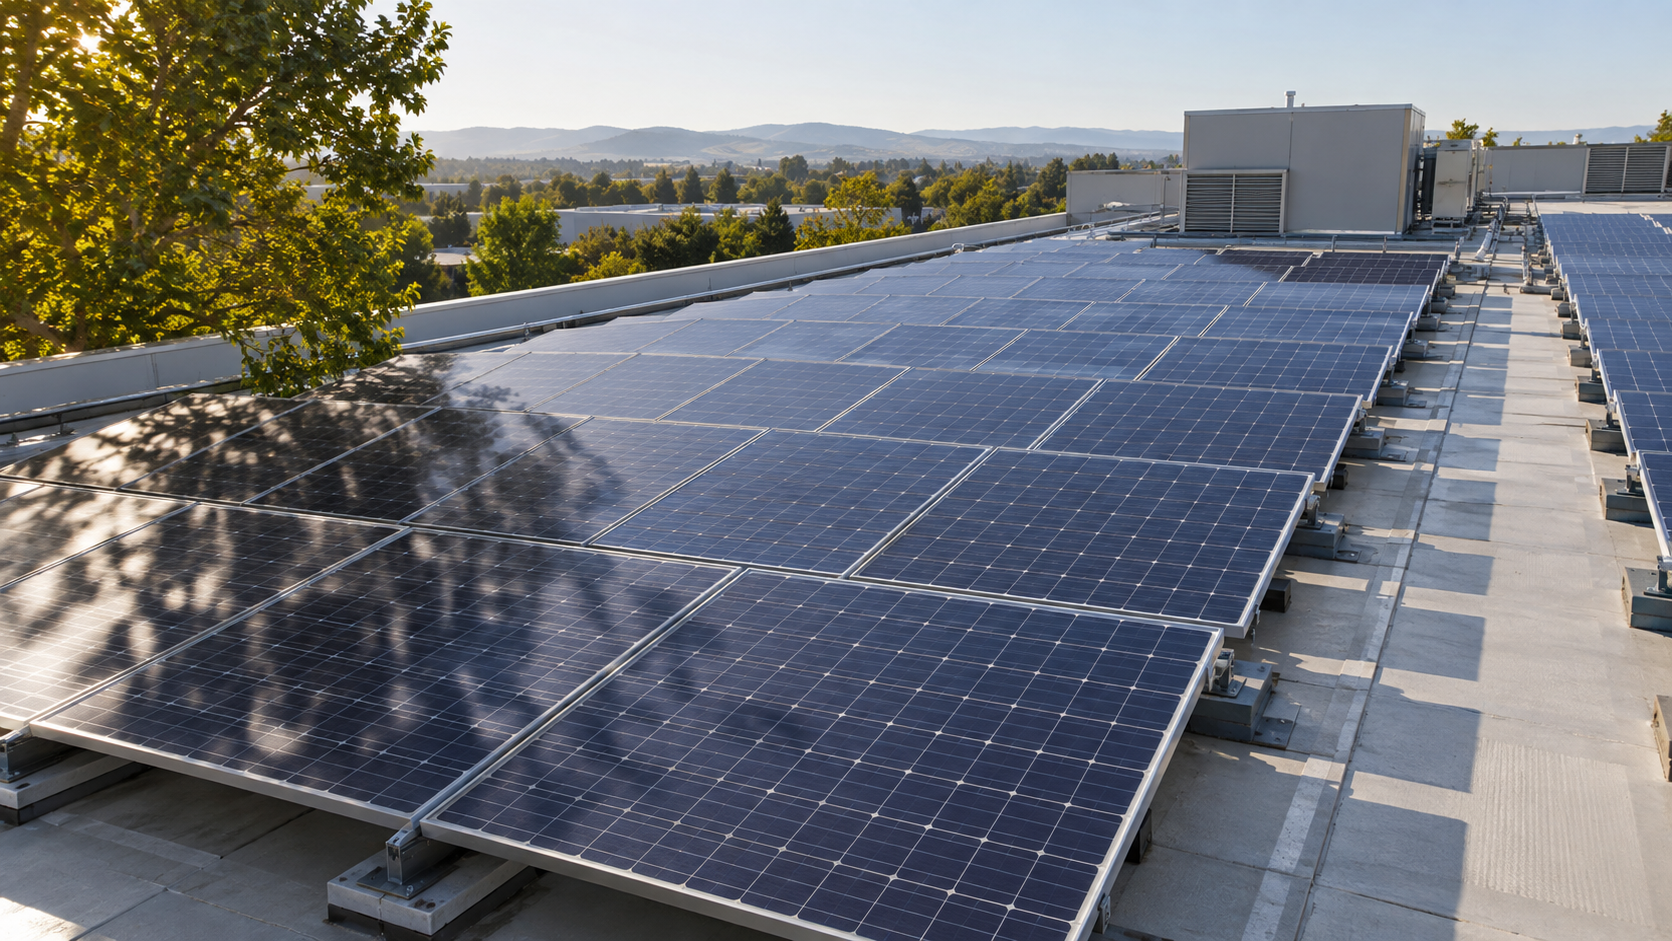
Technical diagram shown at a readable responsive scale.
Typical annual loss figures
Modern crystalline modules are generally warranted at an annual degradation of around 0.4 to 0.55 percent after the first year, with a first-year drop of one to two percent depending on the cell technology. Well-built modules in moderate climates often perform better than their warranty, while hot and humid sites with high ultraviolet exposure and heavy thermal cycling tend to degrade faster.
- First-year drop: roughly 1 to 2 percent, higher for technologies with pronounced light-induced degradation.
- Subsequent years: roughly 0.4 to 0.55 percent per year for mainstream crystalline products.
- Climate effect: hot, humid and high-ultraviolet sites sit at the upper end of the range; temperate sites at the lower end.
- Workmanship effect: poor mounting, module flexing and inadequate cable support accelerate interconnection fatigue independently of cell quality.
PERC vs TOPCon vs HJT lifespan
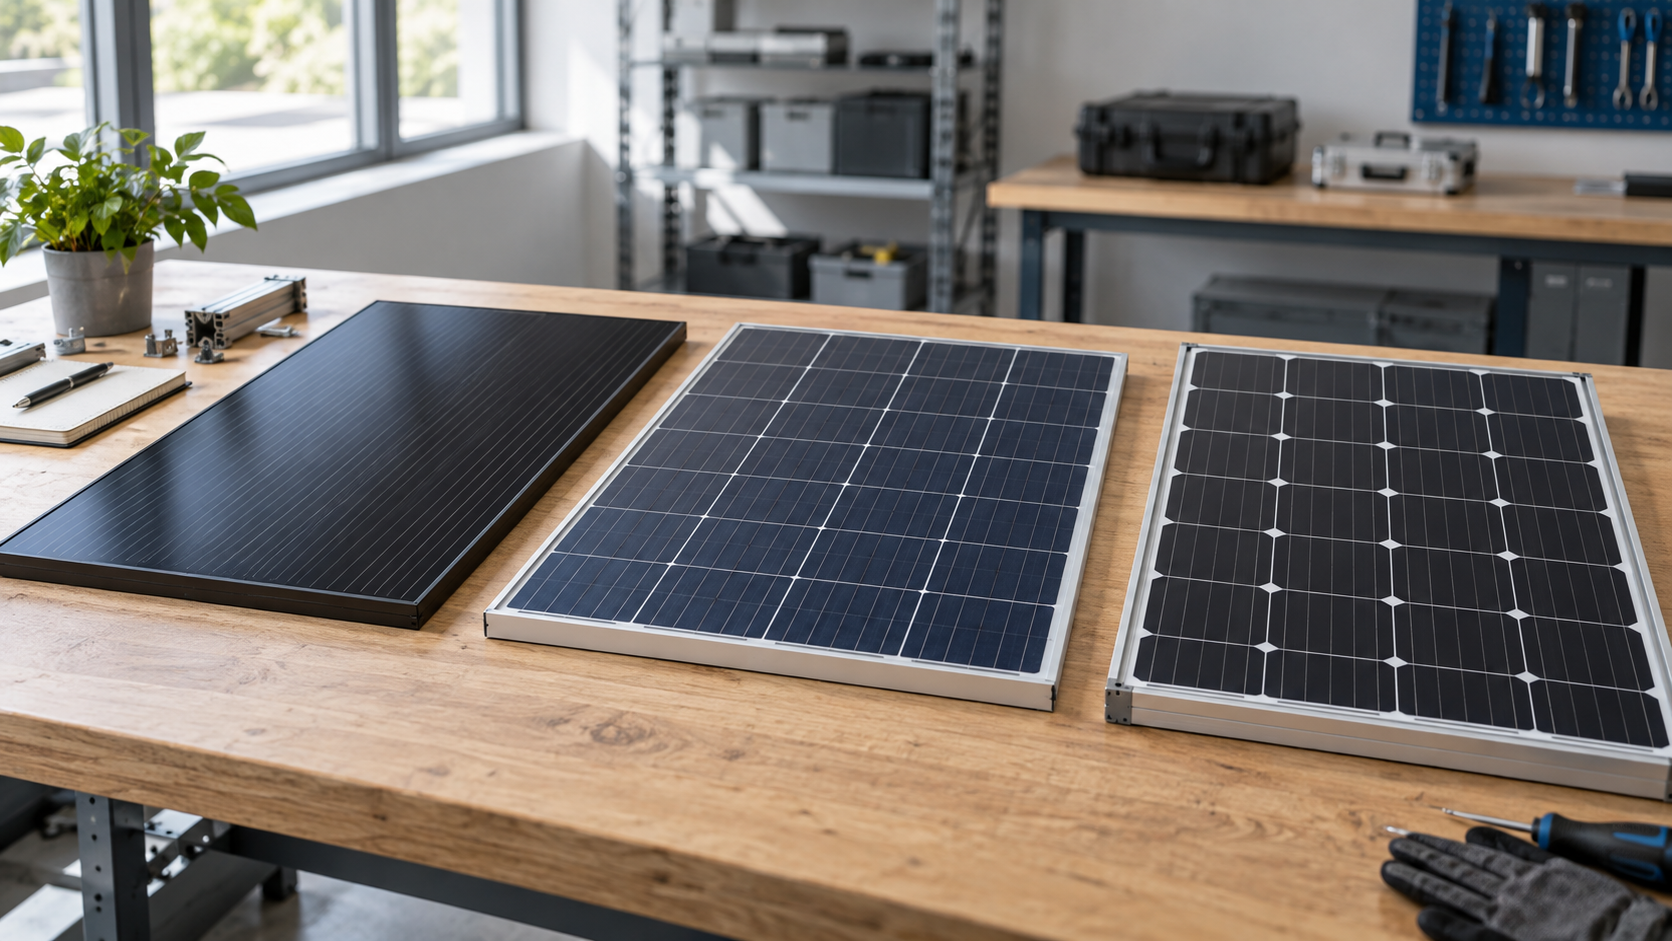
The three mainstream cell architectures age differently. Passivated emitter rear contact cells are the most mature and best characterised, with a well-documented degradation profile but a noticeable first-year loss and a greater sensitivity to potential-induced degradation than newer designs. Tunnel-oxide passivated contact cells typically show a smaller first-year drop and a slightly lower annual rate, benefiting from a more stable passivation layer.
Heterojunction cells generally exhibit the lowest degradation of the three. Their amorphous silicon passivation is less prone to the boron-oxygen defects that drive light-induced degradation, and their more favourable temperature behaviour means the cells operate cooler, reducing thermal stress. In practical terms, a heterojunction module warranted at around 0.25 to 0.35 percent per year may retain noticeably more of its original output at year thirty than an older passivated-rear-contact product warranted at 0.55 percent.
- Passivated rear contact: mature, widely available, largest first-year drop, annual rate around 0.5 to 0.55 percent.
- Tunnel-oxide passivated contact: smaller first-year drop, annual rate around 0.4 percent, now the volume mainstream.
- Heterojunction: lowest first-year drop and lowest annual rate, cooler operation, generally the best long-term retention.
Technical diagram shown at a readable responsive scale.
Year-by-year output projection
Take a module rated at 550 watts with a 1.5 percent first-year loss and 0.45 percent per year thereafter. After year one it delivers about 542 watts. By year ten it is near 520 watts, by year twenty around 497 watts, and at year thirty roughly 476 watts — about 86 percent of the original rating. A more conservative 0.55 percent annual rate lands closer to 82 percent at year thirty, while a 0.30 percent rate retains around 90 percent.
Two consequences follow. First, the difference between technologies compounds into a meaningful energy gap over the asset life, which is why degradation belongs in the procurement comparison alongside efficiency and price. Second, and importantly for equipment selection, the array's peak electrical stress occurs at the beginning of life, not the end. The highest currents and voltages the balance-of-system equipment will ever see are the ones present in year one.
Warranty versus real degradation
A module performance warranty is a floor, not a prediction. It guarantees that output will not fall below a stated percentage of nameplate at defined milestones — commonly around 98 percent after year one and somewhere between 84 and 92 percent at year twenty-five or thirty. Manufacturers set the floor conservatively, so field performance is often better than the warranted line.
Two practical cautions apply. A performance warranty is a commercial promise that depends on the manufacturer still existing and honouring claims decades later, so corporate durability matters as much as the printed figure. And warranty claims almost always require evidence: commissioning records, string-level measurements and a documented maintenance history. Plants with per-string monitoring at the combining point are in a far stronger position to demonstrate a genuine shortfall than plants with only a revenue meter.
Impact on long-term BOS sizing
Because degradation reduces array output over time, the balance-of-system equipment must be rated for the beginning-of-life condition, never for a degraded average. String overcurrent protection is sized on the full short-circuit current of a new string, busbars are rated for the aggregated current of new strings, and insulation and surge protection are selected against the cold-weather open-circuit voltage of new modules.
The corollary is that a correctly specified combining and protection assembly gains margin as the plant ages. If modules are later replaced with higher-current products, however, that margin is consumed — which is why the string protection and busbar rating should be re-checked at any repowering, not assumed to carry over.
- Size string protection and conductors on year-one short-circuit current, not on a degraded projection.
- Rate the busbar and terminations for the summed continuous current of all new strings, with thermal margin for the site's high-temperature condition.
- Select insulation, isolation devices and surge protection against the maximum system voltage of new modules at the lowest expected temperature.
- Specify the enclosure environmental class for the full asset life, since the box must survive the same thirty years as the modules.
Monitoring and early failure
Normal degradation is slow and uniform; failure is fast and localised. Distinguishing the two requires per-string comparison rather than plant-level totals. Strings connected in parallel share the same irradiance and operating voltage, so a string that drifts progressively below its neighbours is showing module-specific degradation, while a string that drops abruptly indicates a fault: a failed bypass diode, a cracked cell, a loose termination or a blown string fuse.
A practical regime combines an annual comparison of string currents against a commissioning baseline, periodic infrared inspection to reveal hot cells and poor connections, and torque verification on terminations, since thermal cycling loosens joints and a high-resistance joint mimics module degradation while actually being a fire risk. Detecting an outlier string in its first year of drift is what keeps a warranty claim viable.
Planning equipment life around the array
Treat the array and the electrical equipment as a single thirty-year asset. Modules degrade predictably; enclosures corrode, gaskets harden, surge protective devices exhaust their energy capacity after repeated events, and fuse holders and terminals lose contact pressure. Surge protection modules in particular should be treated as replaceable service items with a defined inspection interval, not as fit-and-forget components.
A sensible long-term plan sets a monitoring baseline at commissioning, schedules termination and thermal checks, plans surge protection replacement after significant events, and specifies enclosures and internal components for the site's corrosion and temperature class from the outset. NEUTRON reviews the array specification and expected service conditions and prepares a configuration discussion for combining, protection and distribution equipment rated for the full plant life.
This is general technical guidance. Confirm final ratings, protection coordination, installation and applicable local requirements against current standards, manufacturer documentation and the approved project design.
Frequently asked questions
How fast do panels degrade?
Mainstream crystalline modules typically lose one to two percent of rated power in the first year, then roughly 0.4 to 0.55 percent per year on a compounding basis. That places a well-built module at around 82 to 90 percent of its original rating after thirty years.
Does degradation affect combiner sizing?
Not in the direction most people expect. Because output falls over time, the highest current and voltage the combining and protection equipment will ever see occur in year one, so everything must be sized on beginning-of-life values.
Discuss your PV requirement
Share the system voltage, string arrangement, inverter interface and installation environment. NEUTRON can review the equipment configuration around your project documentation.
Discuss a projectContinue learning
Explore related technical guidance in Solar PV.

Published from the approved Period 06 source package. Technical values and final design decisions must be verified against the current applicable standard, manufacturer documentation and approved project design.